Densitogram and Histogram
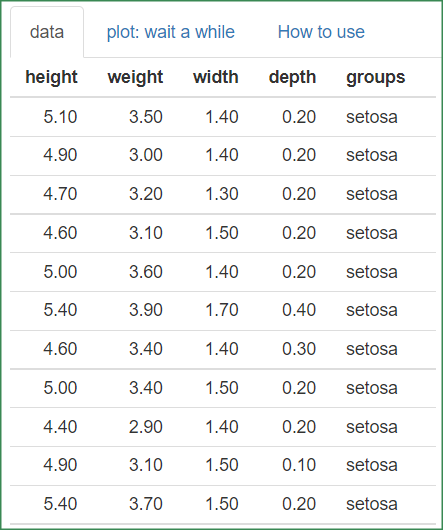
Densitogram and Histogram site : https://tinyurl.com/densitogram-histogram = https://tinyurl.com/densitogram-histogram2 = https://tinyurl.com/densitogram-histogram3 How to Use : The example data has 5 columns. Columns 1 to 4 are numbers (continuous variables). Column 5 is the group variable (nominal variable). 예제 데이터는 5열로 되어 있습니다. 1열부터 4열까지는 숫자(연속변수)입니다. 5열은 집단변수(명목변수)입니다. For X, specify 1 column. Specify 5 columns for 'groups'. X에는 1열을 지정합니다. 'groups'에는 5열을 지정합니다. You will see the histogram in the second tab (plot). 당신은 두번째 탭(plot)에서 histogram을 보게 됩니다. 'Select Plot'에서 'histogram' 대신에 'densitogram'을 선택합니다. In 'Select Plot', select 'densitogram' instead of 'histogram'. 당신은 훌륭한 'densitogram'을 보게 됩니다. You will see a great 'densitogram'. 그래프를 꾸미기 위한 다양한 옵션들이 있습니다. There are many options for decorating the graph. 여러분들이 직접 시행하고 그 결과물을 확인해 보세요. Try it yourself and see the results. 'pl